By Richard Fioravanti
On August 5th, 2021 President Biden announced that he was setting a goal for 50% of new car sales to be electric by 2030. Through a joint statement, Stellantis (new name for Chrysler-Fiat), General Motors, and Ford said they “aspired to achieve sales of 40-50% of annual U.S. volumes of electric vehicles by 2030[1].”
Utilities and stakeholders are asking how real is this? What does this mean for EV adoption? And what should I be looking for to track how fast adoption is going to occur?
The “speed of adoption” has vexed utility commissions, utility planners, and stakeholders for the last three (3) years. The reason for these questions can be shown in the set of charts below in Figure 1.
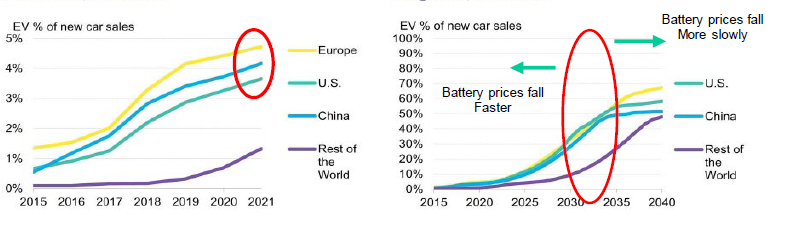
Figure 1: Summary of EV % of New Car Sales and Projected % of New Car Sales 2019
[1] https://www.reuters.com/business/autos-transportation/biden-set-target-50-evs-by-2030-industry-backs-goal-2021-08-05/
The chart on the left shows the EV percentage of New Car Sales at 4%. Predictions – at the time of the publishing of this chart – were that EV percentage of new car sales would top out at approximately 60% in 2040 and be at a level of approximately 25-30% by 2030, as noted in the chart on the right. That timeline would accelerate or decelerate depending on the cost of the batteries in the vehicles and the corresponding vehicle price. It is notable that over the last two years battery prices are falling faster than this projection from 2019, having the potential to accelerate this curve.
However, the dilemma is evident, is the U.S. going to jump from 4% to 25% by 2030? Now, with President Biden’s proclamation, are we going to jump from 4% of new car sales to 50% of new car sales in nine (9) years? Are there any insights that can be tracked or monitored to indicate whether this is going to happen or not?
The best metric may be in examining the sales of the electric Ford F-150. The reason is that despite a plethora of electric vehicle options that are hitting the market, in the U.S., people buy trucks and SUVs. These numbers historically have been approximately 50-50 but over the last 10 years, that share has skewed dramatically with 65% of new car sales being trucks and 35% being sedans. The listing below in Figure 2 shows this more dramatically. The top 10 new car sales are shown for the year 2020. In 2020, Tesla sold 499,500 vehicles (including approximately 26,000 Model X vehicles) – that data was excluded in the chart. Hence, if you only examine the trends of vehicle from traditional manufacturers, that projected percentage mix in sales in the U.S. is increasing. Even when Tesla sales are included, the mix of sales between Trucks/SUVs and sedans is still significantly skewed towards trucks and SUVs.
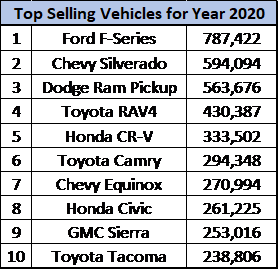
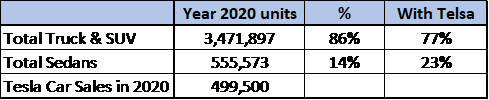
Figure 2: Summary of U.S. New Car Sales in the Year 2020[1]
What does this mean for tracking whether transportation electrification will meet the once optimistic projections in 2017 or now the accelerated projections of President Biden’s proclamation? The answer is to simply watch how the electric Ford F-150 sales track in the U.S. This vehicle is unique, offers innovative features, and in many areas outperforms the its IC-engine-based sibling. You can even power your house over a limited time during an outage. However, if you want to see whether EV sales will track a standard S-Curve upswing with electric vehicles moving past the early adoption stage and hitting a state of Mass Adoption, track the sales of the F-150 to give you an indication if the U.S. is going to see an electric vehicle future soon or whether the world will have to wait a few more years.
[1] https://www.cnbc.com/2021/01/08/pickup-trucks-dominate-americas-10-best-selling-vehicles-of-2020.html