Advanced Data Analytics for the Modern Power System
Data Science in a Changing Power Systems Industry
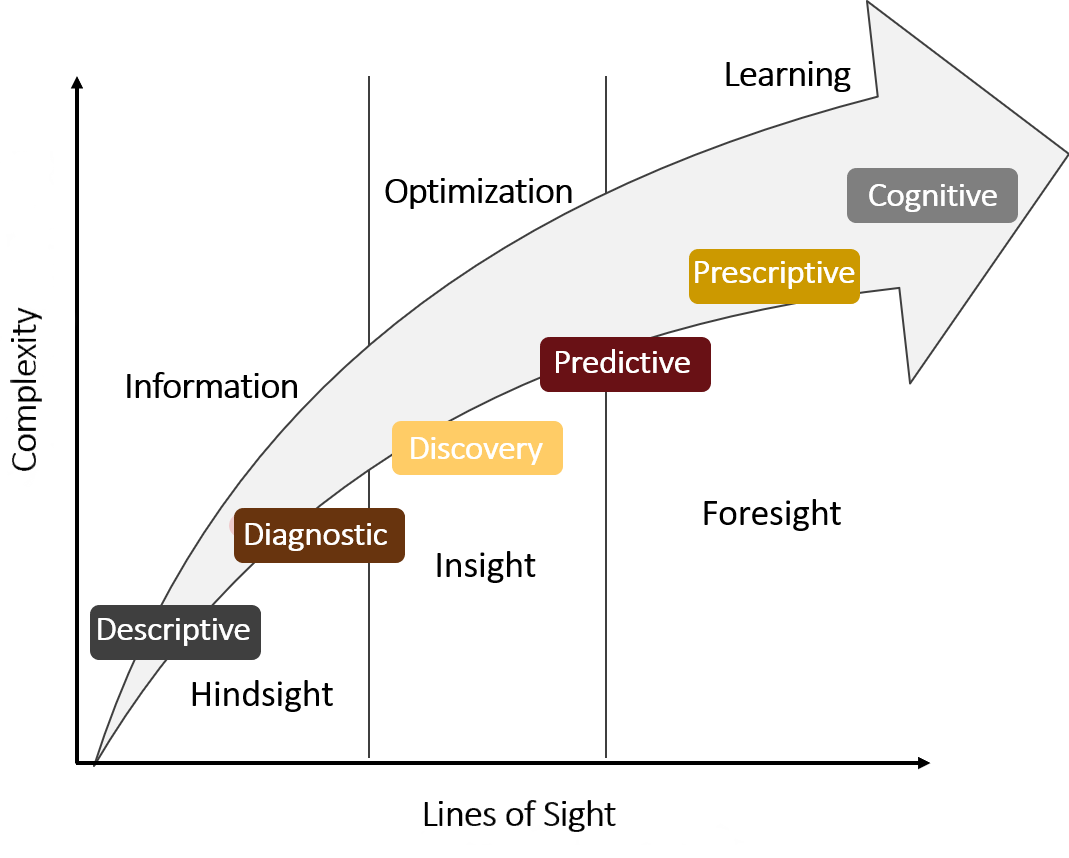
Data analytics can be used to extract insights from utility data, broadly covering three main areas: descriptive, predictive, and prescriptive analytics. While there are other nuanced classifications, applications are generally classified into these three types. Descriptive analytics present raw data in more easily digestible formats, possibly including basic analyses to illustrate statistical information or to derive metadata that are useful to stakeholders. Predictive analytics employ some types of statistical or machine learning tools to model the underlying data to make predictions and anticipate future trends. Prescriptive analytic combine each of these lower level analytics together with business processes to deliver business intelligence and aid in decision making.
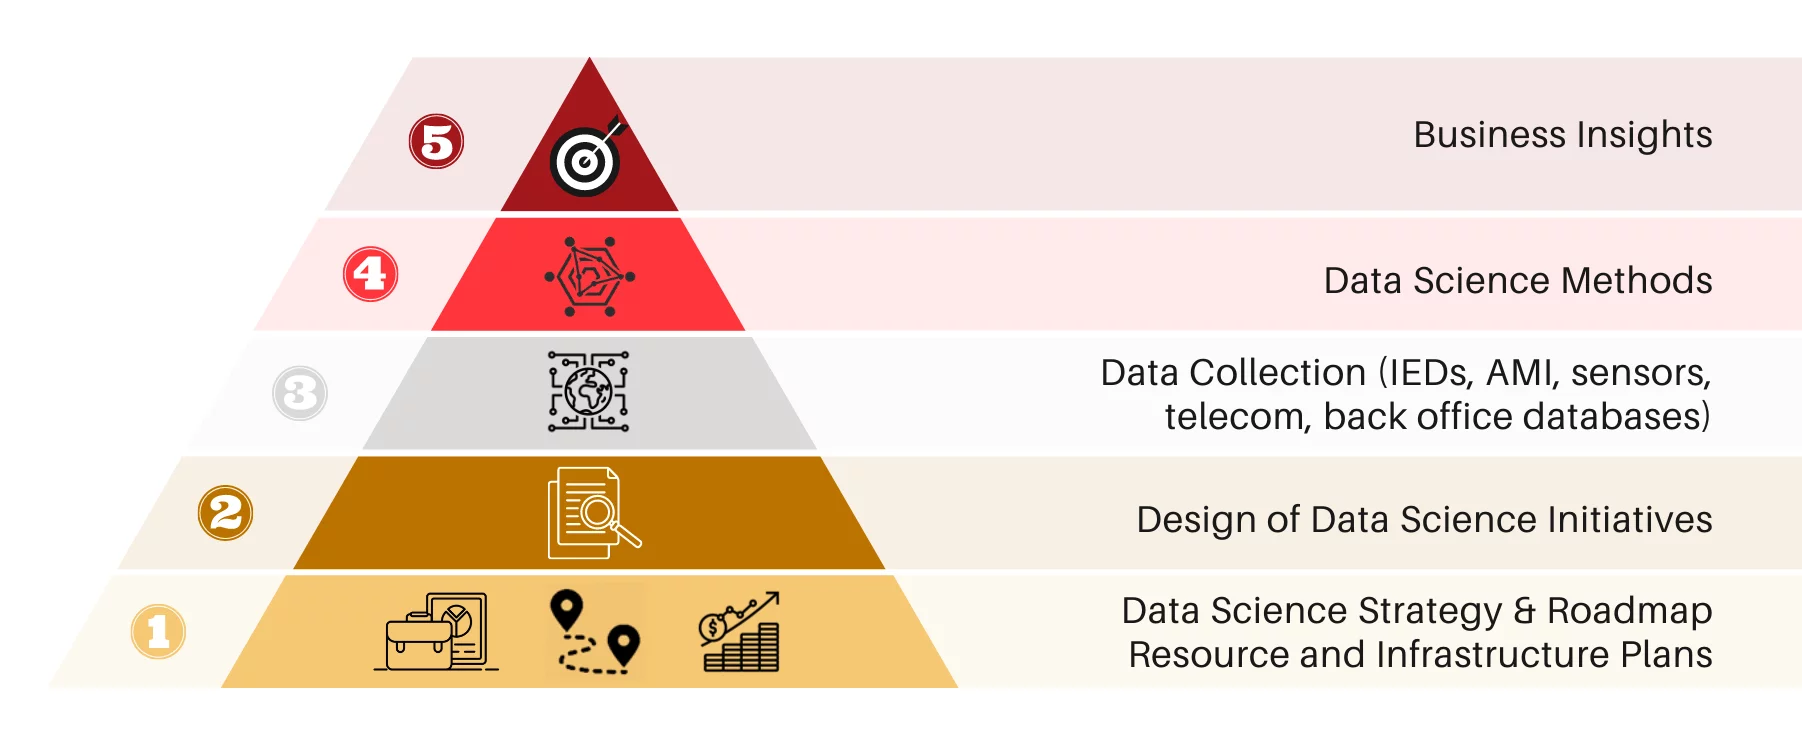
While informative from conceptual standpoint, translating these notions to real utility problems requires development of a data analytics strategy, and input from power system subject matter experts, managers, and data scientists to scope and implement data analytics solutions. The lifecycle of data analytics projects (see inset figure) starts with the devices that generate the data, to data engineering, development of business cases and justifications, and through to the actual implementation of a production system that either runs online or is used within utility processes.
This process is most effective starting with core subject matter expertise and strategic understanding of the utility business model and processes. Data engineers and data scientist are then integrated to the team to engineer and implement solutions that deliver high value to the utility customers. Solid understanding of the systems that produce data and the underlying power system problem being solved has proven invaluable in developing and implementing robust, high-value data analytics solutions.
Quanta Technology has expertise spanning not only strategy formulation and data science applications such as machine learning but also with the specifics of implementation.
Key Applications of Data Analytics for Electric Utilities
Quanta Technology’s capabilities in data analytics covers the entire process from start to finish, offering a unique combination of engineering, development, integration, and applications expertise. Our experts include highly respected engineers with reputations for delivering practical results, and our data processing and management applications are industry-leading in their various fields. A selection of our innovative data analytics applications is provided below.
- Analysis of Intelligent Electronic Devices – Software automation-based routines to query the status and content of protection and control device settings files, from a multitude of sources such as settings repositories, software models, or even directly from field deployed devices. These routines can be configured to detect abnormal or targeted conditions depending on the application, which can vary from validation of protective relay settings according to protection philosophy to confirmation of adherence to update processes through review of timestamp data.
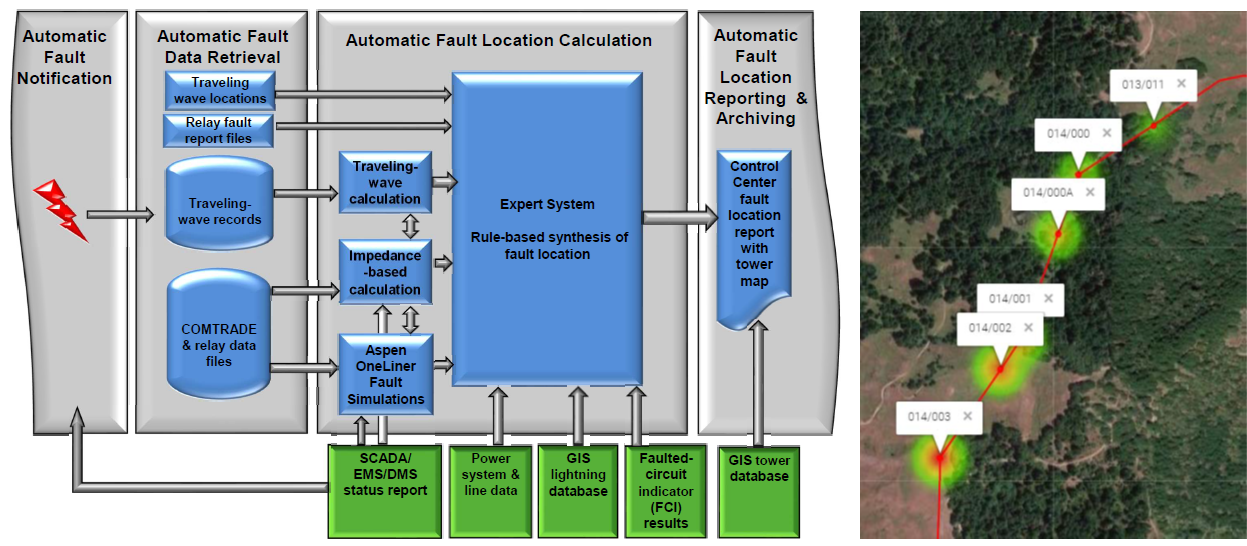
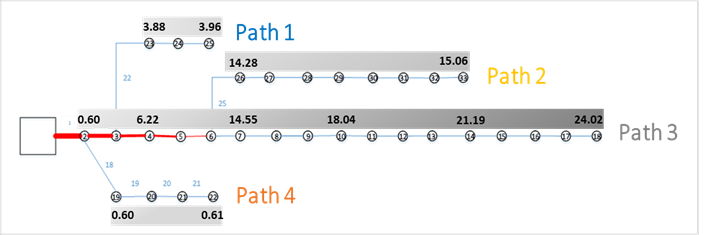
- Automated Fault Location – Determination of fault location through utilization of a custom-developed algorithm that analyzes fault event data, system status, and equipment technical parameters. This application employs an integration of data and processes through software-based automation, including automatic retrieval of fault event data from field-deployed devices, linking with software simulation packages to test fault estimations, and output to map and GIS-based resources to provide personnel with a visual estimate of fault location on a topographical map.
- Compliance Report Generation – Automated generation of engineering summaries and formal audit-ready reports for NERC PRC and CIP compliance standards such as PRC-023, PRC-026, PRC-027, and CIP-10. These summaries and reports are intended to both provide engineers a quick view of the compliance status of their scope of study (could be up to the entire BES system) and represent the detailed documentation required by auditors to show proof-of-compliance.
- Performance Assessment for Voltage Optimization programs – VO is an advanced application that runs at the control center for distribution systems or in substation automation systems. By reducing distribution feeder voltage and actively monitoring service voltage, VO promises to reduce energy consumption. To assure that VO works effectively, a Performance Assessment tool is needed. The tool processes AMI data (Advanced Metering Infrastructure) over long time periods (months), and evaluates VO program performance across thousands of distribution circuits. In addition, it is capable of identifying best bellwether meter candidates for VO operation.
- EV Infrastructure Planning – Data analytics applied to two aspects of planning for public-charging infrastructure: Locations of charging stations, and number of chargers (and kW ratings) per location. Quanta Technology’s data analytics involves a large time window (many weeks) and fuses together data from the utility domain (substation and grid expansion), transportation networks (traffic pickups and drop-offs, travel time to charging locations), and charging characteristics of EVs.
- DERs as Non-wires Alternatives (NWA) – Many states are pursuing NWAs, which has resulted in the need to develop formal approaches to accurately value Distributed Energy Resources (DER) and their benefits. Quanta Technology has developed a framework and tool that addresses the critical gaps found in existing NWA analyses. Central to the framework is the Locational Marginal Value (LMV), measured in $/kW and $/kVAr, that is associated with specific locations along a distribution circuit and is varying with time (hourly). The tool incorporates a sophisticated optimization process that evaluates each location based on DER size, technology, and characteristics. The tool then provides users with an intuitive presentation of DER valuation.
Why Quanta Technology
Quanta Technology’s capabilities in data analytics combines utility engineering leadership and expertise with specialists in data processing and management applications. Our goal is to not only make use of the latest technical innovations but to also deliver practical results that improve the utility business.
Resources
Blog Post: Advanced Data Analytics for the Modern Power System
Webinar Registration: Utility Business Intelligence Through Data Analytics