Advanced Data Analytics for the Modern Power System
Emerging Data Analytics in a Changing Power Systems Industry
The power industry of the 21st Century is experiencing major changes. On the one hand, the societal push toward decarbonization has resulted in many smaller resources that replace large, centralized power plants—this has complicated the way the utility companies plan and operate their grids. On the other hand, advances in sensors and data communications have made it possible for utilities to economically deploy means for data collection, of great resolution and accuracies, virtually anywhere on the grid. The new data enables engineers not only to improve how old problems in planning and operations are solved, but also to solve new problems. In other words, the era of Big Data has arrived for the power industry. There are three aspects of Big Data:
- Quantity – As a general trend for modern computing hardware, storage and processing capabilities have vastly improved, greatly increasing the amount of data that may be gathered. This enables the data to cover both longer periods as well as offer greater resolution.
- Breadth – The greater availability of modern computing hardware has made it possible to add data gathering systems to more equipment than ever before. Engineers today have access to data from a multitude of monitoring and recorded sources, covering both individual field-deployed hardware as well as database systems for asset and information management. In addition to the breadth of data types, the migration to microprocessor-drive hardware and databases also vastly expands the scope of data, providing engineers with greater system coverage of data.
- Accessibility – Modern communication protocols and the drive for greater system integration have given engineers quicker and easier access to both monitored and stored data, potentially improving the responsiveness and relevancy of data analytics. This covers not only system data obtained from field, but also supporting records such as asset management systems and equipment technical data.
Key Applications of Data Analytics for Electric Utilities
Quanta Technology’s capabilities in data analytics covers the entire process from start to finish, offering a unique combination of engineering, development, integration, and applications expertise. Our experts include highly respected engineers with reputations for delivering practical results, and our data processing and management applications are industry-leading in their various fields. A selection of our innovative data analytics applications is provided below.
- Analysis of Intelligent Electronic Devices – Software automation-based routines to query the status and content of protection and control device settings files, from a multitude of sources such as settings repositories, software models, or even directly from field deployed devices. These routines can be configured to detect abnormal or targeted conditions depending on the application, which can vary from validation of protective relay settings according to protection philosophy to confirmation of adherence to update processes through review of timestamp data.
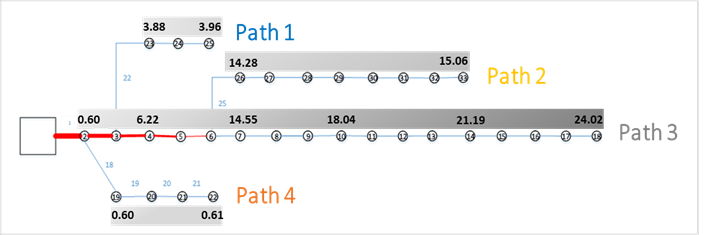
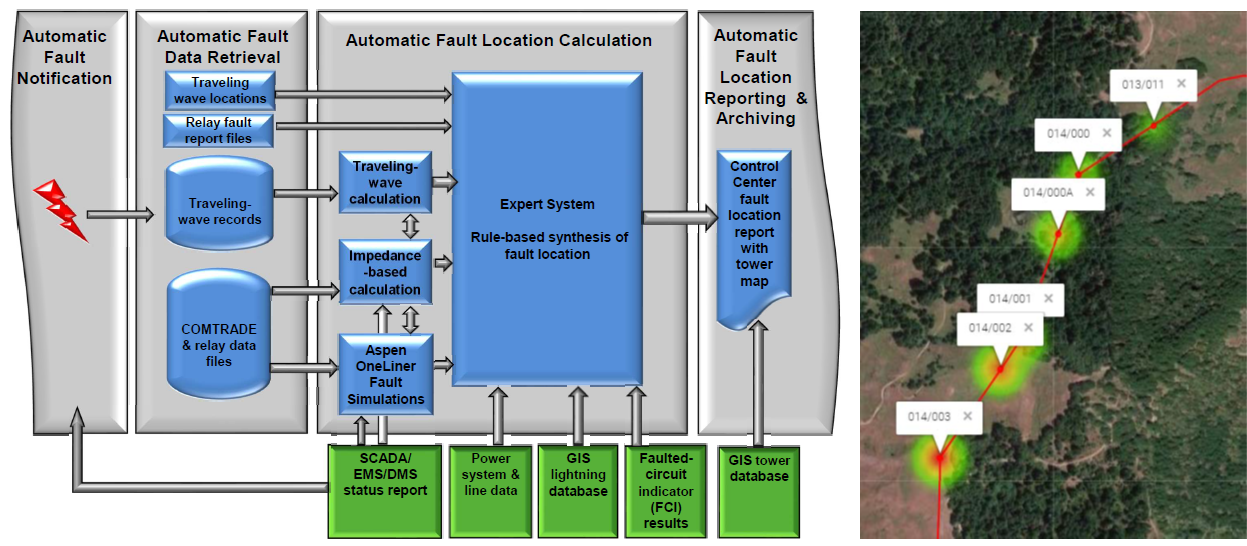
- Automated Fault Location – Determination of fault location through utilization of a custom-developed algorithm that analyzes fault event data, system status, and equipment technical parameters. This application employs an integration of data and processes through software-based automation, including automatic retrieval of fault event data from field-deployed devices, linking with software simulation packages to test fault estimations, and output to map and GIS-based resources to provide personnel with a visual estimate of fault location on a topographical map.
Key Applications of Data Analytics for Electric Utilities
Quanta Technology’s capabilities in data analytics covers the entire process from start to finish, offering a unique combination of engineering, development, integration, and applications expertise. Our experts include highly respected engineers with reputations for delivering practical results, and our data processing and management applications are industry-leading in their various fields. A selection of our innovative data analytics applications is provided below.
- Analysis of Intelligent Electronic Devices – Software automation-based routines to query the status and content of protection and control device settings files, from a multitude of sources such as settings repositories, software models, or even directly from field deployed devices. These routines can be configured to detect abnormal or targeted conditions depending on the application, which can vary from validation of protective relay settings according to protection philosophy to confirmation of adherence to update processes through review of timestamp data.
- Automated Fault Location – Determination of fault location through utilization of a custom-developed algorithm that analyzes fault event data, system status, and equipment technical parameters. This application employs an integration of data and processes through software-based automation, including automatic retrieval of fault event data from field-deployed devices, linking with software simulation packages to test fault estimations, and output to map and GIS-based resources to provide personnel with a visual estimate of fault location on a topographical map.
- Compliance Report Generation – Automated generation of engineering summaries and formal audit-ready reports for NERC PRC and CIP compliance standards such as PRC-023, PRC-026, PRC-027, and CIP-10. These summaries and reports are intended to both provide engineers a quick view of the compliance status of their scope of study (could be up to the entire BES system) and represent the detailed documentation required by auditors to show proof-of-compliance.
- Performance Assessment for Voltage Optimization programs – VO is an advanced application that runs at the control center for distribution systems or in substation automation systems. By reducing distribution feeder voltage and actively monitoring service voltage, VO promises to reduce energy consumption. To assure that VO works effectively, a Performance Assessment tool is needed. The tool processes AMI data (Advanced Metering Infrastructure) over long time periods (months), and evaluates VO program performance across thousands of distribution circuits. In addition, it is capable of identifying best bellwether meter candidates for VO operation.
- EV Infrastructure Planning – Data analytics applied to two aspects of planning for public-charging infrastructure: Locations of charging stations, and number of chargers (and kW ratings) per location. Quanta Technology’s data analytics involves a large time window (many weeks) and fuses together data from the utility domain (substation and grid expansion), transportation networks (traffic pickups and drop-offs, travel time to charging locations), and charging characteristics of EVs.
- DERs as Non-wires Alternatives (NWA) – Many states are pursuing NWAs, which has resulted in the need to develop formal approaches to accurately value Distributed Energy Resources (DER) and their benefits. Quanta Technology has developed a framework and tool that addresses the critical gaps found in existing NWA analyses. Central to the framework is the Locational Marginal Value (LMV), measured in $/kW and $/kVAr, that is associated with specific locations along a distribution circuit and is varying with time (hourly). The tool incorporates a sophisticated optimization process that evaluates each location based on DER size, technology, and characteristics. The tool then provides users with an intuitive presentation of DER valuation.